
Free PC Build Analyzer 2026
Bottleneck Calculator 2026
Check if your CPU or GPU is holding back performance — instant bottleneck % and efficiency score.
Select Your PC Parts
CPU, GPU, resolution & usage — updated for 2026 hardware
Results appear here
Select your parts above, then click Calculate Bottleneck.
Your Results
How to Read Your Score
Lower bottleneck % = better · Higher efficiency = better
-
0% – 5% — Excellent Efficiency 95–100. CPU & GPU are well matched. No upgrade needed.
-
5% – 15% — Fair Efficiency 85–94. Minor imbalance — upgrade optional.
-
15%+ — Poor Efficiency below 85. One part is holding you back — upgrade recommended.
Estimates based on 2026 hardware tiers — for reference only, not a substitute for real-world benchmarks.
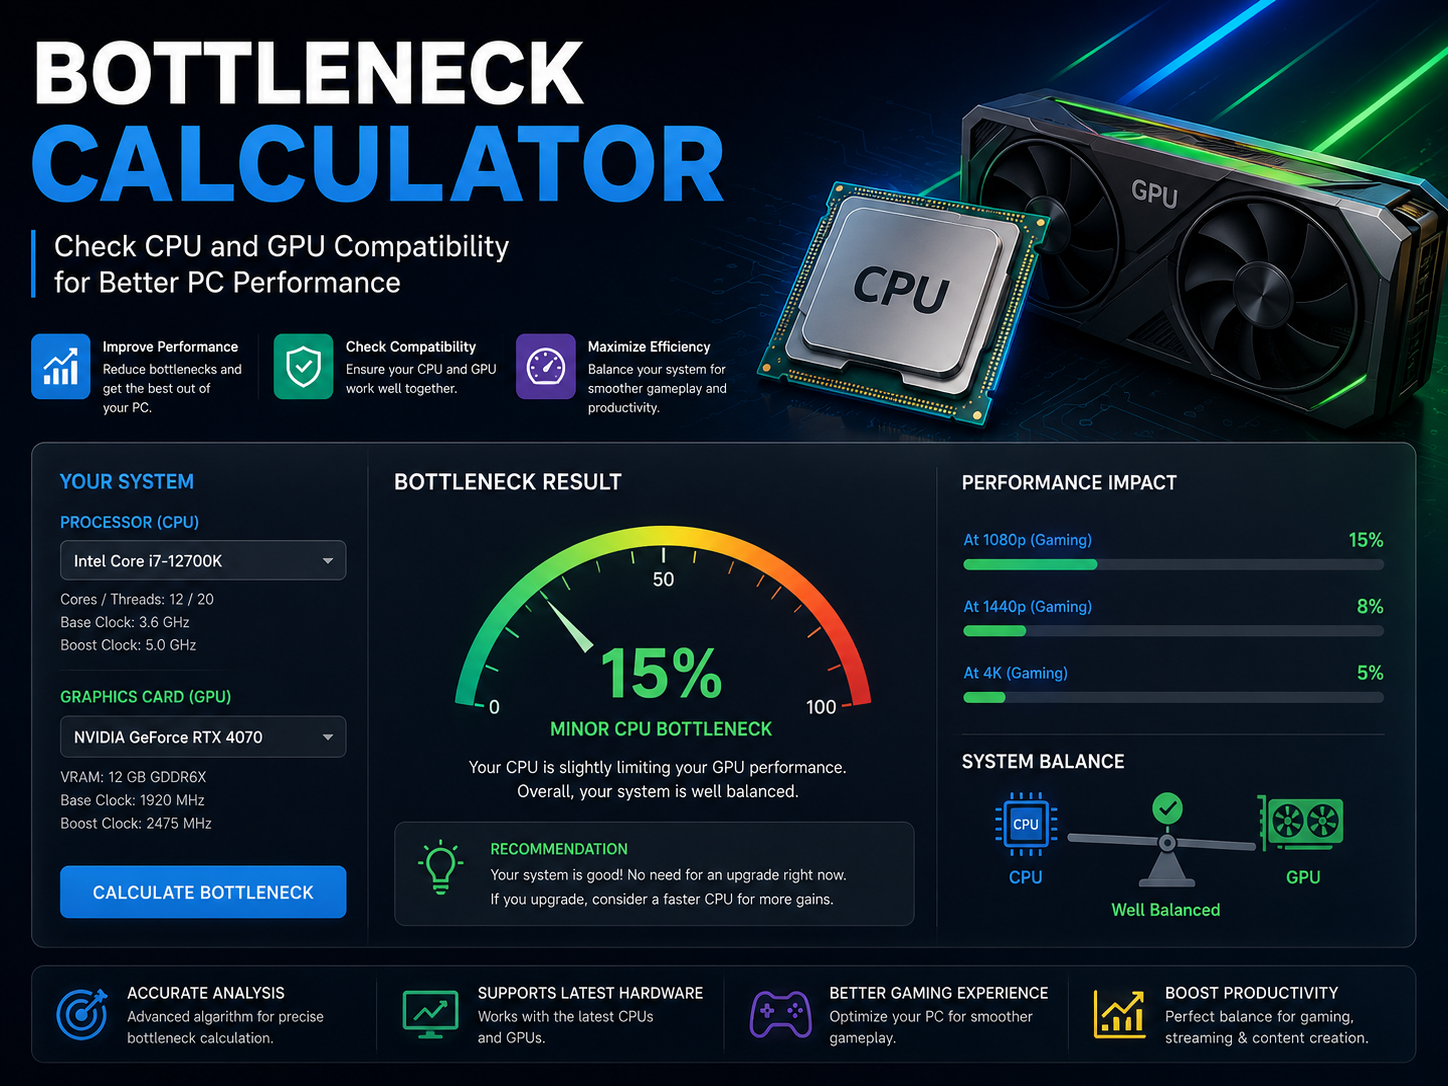
Bottleneck Calculator: Check CPU and GPU Compatibility for Better PC Performance
Planning a new gaming PC, upgrading a single component, or troubleshooting low FPS? The Bottleneck Calculator below estimates how well your CPU, GPU, RAM, and storage work together, and tells you which single upgrade will give you the biggest real world performance gainbefore you spend any money.
A balanced PC isn’t the one with the most expensive parts. It’s the one where no single component is forced to wait on another. Enter your hardware below to get a bottleneck percentage, a system efficiency score, and a specific upgrade recommendation.
What Is a Bottleneck Calculator?
A bottleneck calculator is a diagnostic tool that estimates whether your processor and graphics card are properly matched for your chosen resolution and workload. It compares the relative performance ceiling of each component and reports the percentage gap between them.
Think of your PC as a relay team. Each component hands off work to the next. If one runner is slower than the rest, the whole team’s time suffers no matter how fast the other runners are. That slower runner is your bottleneck.
Three common patterns this tool flags:
Memory or storage limited: slow RAM or a mechanical hard drive doesn’t usually change your average FPS, but it does increase load times, stutter, and 1% low frame dips.
GPU limited: a fast graphics card paired with an older CPU caps your frame rate well below what the GPU is actually capable of.
CPU limited: a high-end processor paired with a weak GPU leaves CPU horsepower unused, since the graphics card can’t keep up with the frames the CPU is ready to send.
How the Bottleneck Percentage Is Calculated
Our score is built from three weighted inputs, not a single benchmark number:
- Relative performance index: Each CPU and GPU is scored against a normalized benchmark database (single-thread and multi thread CPU performance; 1080p/1440p/4K GPU performance) drawn from published third party benchmark suites.
- Resolution adjustment: The calculator re-weights CPU vs. GPU influence based on your selected resolution, since CPU dependency drops sharply as resolution increases.
- Workload profile: Game genre (competitive shooter, open-world, strategy, simulation) shifts the weighting further, since CPU bound titles respond differently than GPU bound titles.
Example: a Ryzen 5 5600 paired with an RTX 4070 at 1080p returns an estimated 12–18% CPU side bottleneck in CPU intensive titles, but under 5% at 4K, where the GPU becomes the limiting factor regardless of processor. This is why resolution is the single biggest variable in any bottleneck estimate, and why a result calculated for 4K should never be applied to a 1080p build.
CPU and GPU Compatibility: What It Actually Means
CPU and GPU compatibility isn’t about whether the parts physically fit together almost any modern CPU and GPU will run on the same motherboard. It’s about whether they’re matched closely enough in performance tier that neither one is sitting idle waiting on the other.
Why CPU and GPU Balance Matters
Pair a new, high end GPU with a five year old mid range CPU, and the GPU will often sit at 60–75% utilization in CPU heavy titles instead of the 95–99% you’d expect from hardware in that class. Frame rates plateau, and you may notice stutter even though the GPU itself isn’t under heavy load.
The reverse also happens: a top-tier CPU paired with a budget GPU spends much of its time idle, waiting for the graphics card to finish rendering each frame. In both directions, you paid for performance you aren’t using.
Four Compatibility Mistakes Worth Avoiding
- Buying the most powerful GPU available: match the GPU tier to your CPU tier and target resolution, not to your budget ceiling alone.
- Ignoring resolution: a pairing that’s GPU bound at 4K can become CPU-bound at 1080p, and the “better” upgrade path flips accordingly.
- Overlooking RAM speed and capacity: 16GB at slow timings can quietly cap a fast CPU’s real world performance in newer titles.
- Trusting synthetic benchmarks alone: a high Cinebench or 3DMark score doesn’t always translate to the same lead in actual gameplay, since real games are bottlenecked differently than synthetic tests.
How to Use the Bottleneck Calculator
Select your processor
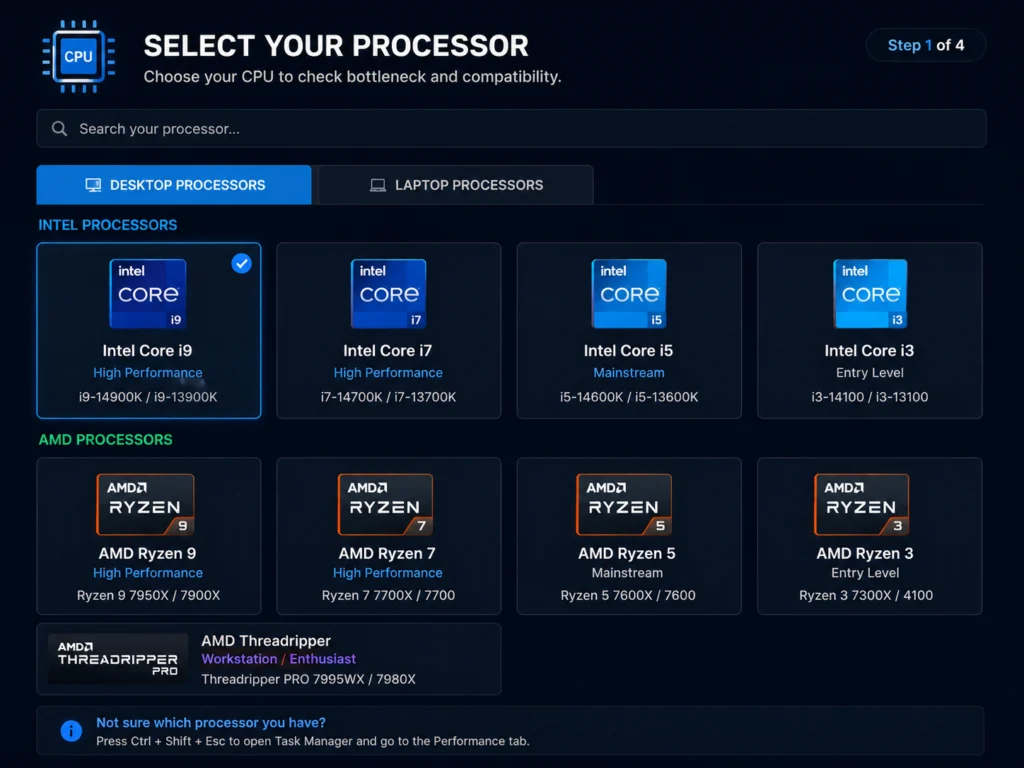
The CPU you currently own, or one you’re considering. CPU performance primarily affects game logic, physics calculations, AI behavior, and background tasks like streaming or recording.
Select your graphics card
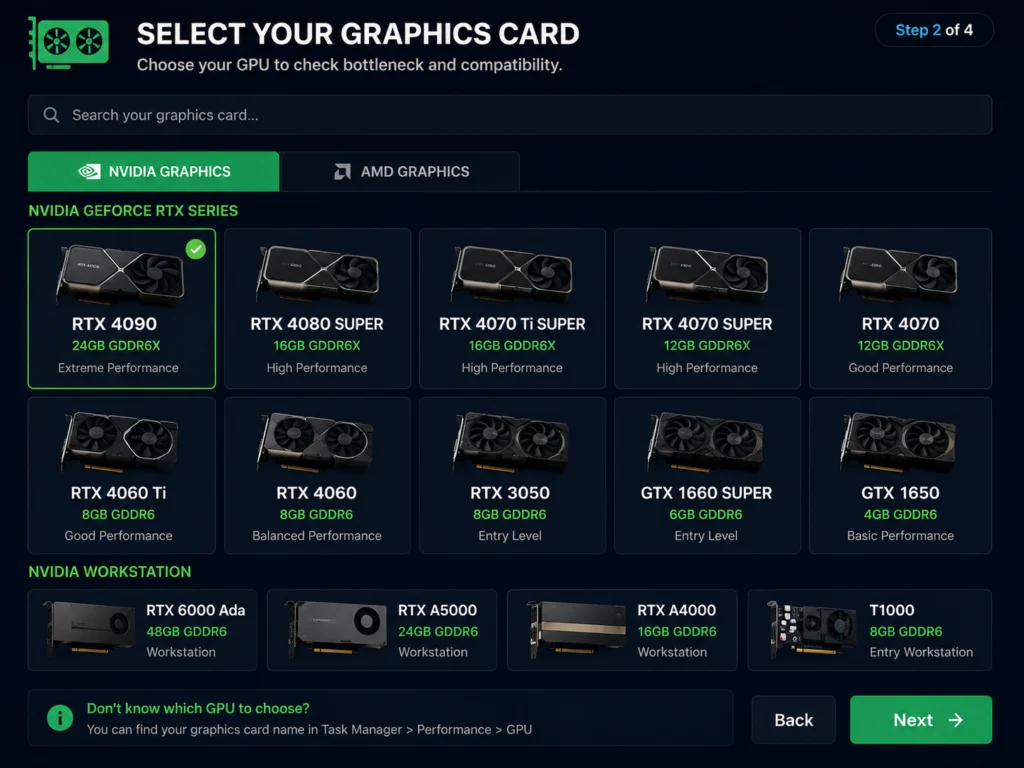
The GPU you currently own, or one you’re considering. GPU performance primarily affects resolution scaling, texture quality, ray tracing, and overall visual fidelity.
Choose your resolution
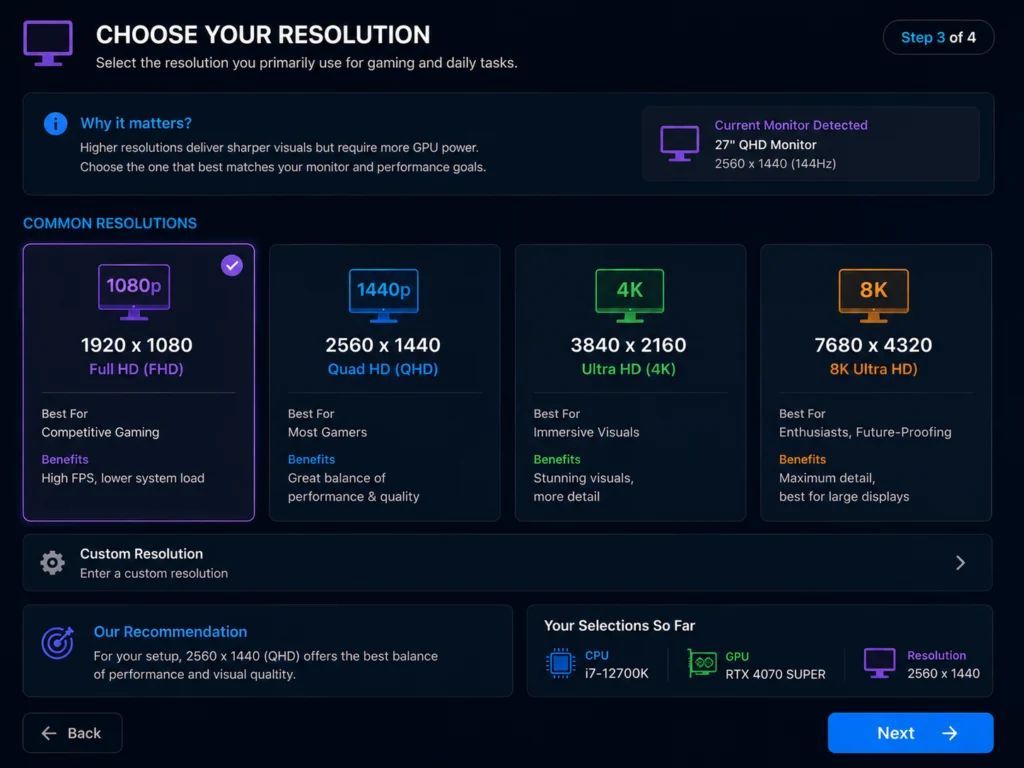
1080p, 1440p, or 4K. Higher resolutions shift more of the workload onto the GPU; lower resolutions shift more of it onto the CPU.
Review your results
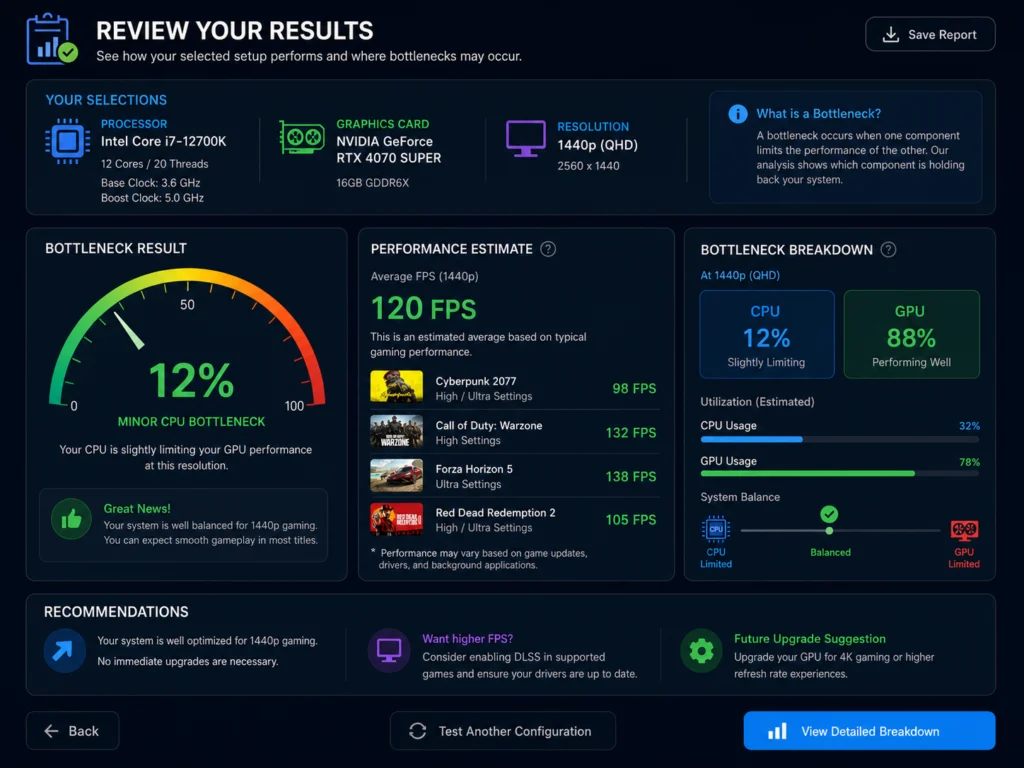
A bottleneck percentage, a system efficiency score, an expected FPS range for common workloads, and a specific upgrade recommendation if a significant imbalance is detected.
Understanding Your Results
| Metric | What It Tells You |
|---|---|
| Bottleneck percentage | How much one component limits the other. Under 10% is generally negligible; 10–20% is worth monitoring; above 20% usually means a real world FPS or smoothness impact. |
| System efficiency score | How well your major components work together as a whole, factoring in CPU, GPU, RAM, and storage balance not just the CPU/GPU pairing. |
| Expected FPS range | A benchmark derived estimate for typical workloads at your chosen resolution. Treat this as a range, not a guarantee. |
| Gaming performance tier | Where your build sits in the broader market: entry level, mainstream, high performance,or enthusiast. |
| Upgrade recommendation | The single change most likely to reduce your bottleneck, ranked by expected impact. |
There is no universal acceptable bottleneck percentage that applies to every build. A 15% bottleneck on a budget 1080p system and a 15% bottleneck on a high refresh competitive setup carry very different real world weight. Use the percentage as a comparison tool between configurations, not as a pass/fail grade.
Types of PC Bottlenecks: CPU, GPU, RAM, and Storage Explained
Most people assume a bottleneck is always about the CPU and GPU. In reality, four separate components can each become the limiting factor in your system: the processor, the graphics card, memory, and storage. Knowing which one is actually holding you back is the difference between a worthwhile upgrade and a wasted purchase.
CPU Bottleneck
A CPU bottleneck happens when the processor can’t feed work to the graphics card fast enough. The CPU hits its limit first, and the GPU is left waiting for instructions instead of rendering at full capacity.
This shows up most often in:
- Competitive, high-refresh-rate gaming (144Hz and above)
- CPU intensive genres: strategy, simulation, and large open world titles
- Any session where you’re also streaming, recording, or running heavy background apps
Signs You’re CPU-Bottlenecked
- High CPU usage: the processor sits near 90–100% utilization during gameplay.
- Low GPU usage: the graphics card stays well below its expected load, often 60–75% in a title where it should be near 95–100%.
- Inconsistent frame rates: FPS fluctuates even though your graphics settings haven’t changed.
- Stuttering: short pauses or frame-time spikes appear as the CPU struggles to keep up with game logic.
- Weak multitasking performance: running a game alongside streaming software or a browser causes a noticeable drop.
Common CPU Bottleneck Scenario
A Ryzen 5 2600 paired with a current mid-to-high-end GPU is a textbook example: in CPU-heavy titles, the graphics card may only reach 60–70% utilization because the six-year-old processor can’t supply frames fast enough to use it fully. The same pairing performs much better in GPU-heavy titles, where the CPU’s limitation matters less.
GPU Bottleneck
A GPU bottleneck happens when the graphics card reaches its limit before the processor does. For most gamers, this is the healthier of the two bottlenecks, because it means the GPU the component actually rendering your game is being used to its full potential.
Signs You’re GPU-Bottlenecked
- GPU usage near maximum: utilization consistently sits at 95–100%.
- Stable CPU usage: the processor has headroom to spare while the GPU is fully loaded.
- FPS drops at higher settings: raising texture quality, shadows, or resolution directly reduces frame rate.
- Resolution sensitivity: the gap becomes more noticeable at 1440p and especially at 4K.
Common GPU Bottleneck Scenario
A high-end CPU paired with an entry-level GPU, or any system running ray tracing and ultra settings at 4K, will typically be GPU-bound. In this case, the most effective upgrade is almost always the graphics card, not the processor.
RAM Bottleneck
Memory limitations affect both responsiveness and gaming performance, though differently from a CPU or GPU bottleneck.
Signs of a RAM Bottleneck
- Frequent stuttering: noticeable pauses as the system swaps data, especially in large open-world titles.
- High memory usage: RAM utilization consistently sits near full capacity during normal use.
- Slow application switching: alt-tabbing between programs feels delayed.
- Reduced performance in newer titles: modern AAA games increasingly recommend 16GB as a minimum and 32GB for the smoothest experience.
DDR4 vs. DDR5: What Actually Changes
DDR5 offers meaningfully higher bandwidth than DDR4 typically double or more at equivalent price points — and better long-term scalability as motherboard platforms move on. In practice, the real-world FPS difference between DDR4 and DDR5 in most games is modest, often in the single digits, with the gap widening only in specific CPU-bound or memory-bandwidth-sensitive titles.
Dual-Channel Is the Upgrade Most People Skip
Running memory in dual channel mode (two matched sticks instead of one) can meaningfully improve bandwidth at effectively no cost, since it requires no new hardware purchase if you already own a second matching stick. It’s one of the simplest performance gains available and is frequently overlooked.
Storage Bottleneck
Storage performance affects loading times and overall responsiveness. It rarely changes your average in-game FPS directly, but it has a large effect on the experience around the game itself.
SSD vs. HDD
A SATA SSD loads games and boots Windows several times faster than a traditional mechanical hard drive, and meaningfully reduces stutter caused by asset streaming in open-world titles.
NVMe: When It’s Worth the Upgrade
NVMe drives read and write significantly faster than SATA SSDs. The difference matters most for large file transfers, video editing, content creation, and games that stream large open-world assets in real time. For a typical gamer running mostly older or smaller titles, the jump from SATA SSD to NVMe is noticeable but not dramatic; for content creators and large modern open-world games, it’s a clearer upgrade.
Signs of a Storage Bottleneck
- Loading screens take noticeably longer than expected for the game’s size
- Applications take several seconds or more to open
- Large file transfers feel slow relative to your drive’s rated speed
- The system feels generally sluggish during storage-heavy tasks like installs or transfers
CPU Bottleneck vs. GPU Bottleneck: Quick Comparison
| Signal | CPU Bottleneck | GPU Bottleneck |
|---|---|---|
| CPU usage | High (90–100%) | Moderate, with headroom to spare |
| GPU usage | Low (60–75%) | Near maximum (95–100%) |
| Raising graphics settings | Little to no FPS change | FPS drops noticeably |
| Raising resolution | Often improves GPU utilization | Makes the bottleneck worse |
| Best upgrade path | Upgrade the CPU, or lower resolution-independent settings | Upgrade the GPU |
How Workload Changes Which Bottleneck You Hit
Gaming Workloads
- CPU-intensive games: titles built around physics, AI behavior, and world simulation (strategy, simulation, large open world games) lean on the processor.
- GPU-intensive games: titles built around high fidelity visuals, ray tracing, and advanced lighting lean on the graphics card.
Streaming Workloads
Streaming adds simultaneous game rendering, video encoding, and background software management on top of the game itself, which is why a balanced CPU matters more for streamers than for gamers who don’t stream.
Content Creation Workloads
Video editing, timeline playback, and rendering stress both the CPU and GPU, with the ideal balance depending heavily on which software you use some renderers lean CPU heavy, others lean on GPU acceleration.
Productivity Workloads
Office work, browsing, and general productivity rarely stress a modern CPU or GPU. Here, storage speed and memory responsiveness usually matter more than raw processing power.
What Causes PC Bottlenecks
- Mismatched CPU and GPU performance tiers
- Insufficient RAM capacity or single-channel configuration
- Slow storage (mechanical HDD instead of SSD/NVMe)
- Thermal throttling from inadequate cooling
- Outdated GPU or chipset drivers
- Excessive background applications competing for CPU or RAM
- Aging hardware that was balanced for its era but not for current titles
Identifying the actual cause before upgrading is the entire point of running your specs through a bottleneck calculator first it tells you which of these factors is realistically costing you performance, instead of guessing.
Hardware-Accelerated GPU Scheduling: Should You Turn It On?
Hardware Accelerated GPU Scheduling (HAGS) is a Windows feature that hands certain frame-scheduling tasks from the CPU over to the graphics card itself. The goal is lower latency and a more direct communication path between the two. Whether it actually helps you depends heavily on your specific hardware, not on the feature in general.
What Hardware-Accelerated GPU Scheduling Actually Does
Normally, Windows uses the CPU to manage the queue of rendering tasks sent to the GPU. HAGS shifts part of that scheduling work onto a dedicated processor built into the graphics card, cutting out a layer of CPU side overhead.
Should You Turn It On or Off?
There’s no single answer that applies to every system. In practice:
- Systems that may see a small benefit: CPU-bottlenecked systems running high-refresh-rate competitive titles, where shaving CPU overhead has the most room to matter.
- Systems that may see no difference: GPU-bottlenecked systems, where the CPU already has spare headroom and isn’t the limiting factor.
The most reliable approach is to benchmark the same game and scene with the setting on and off, using a frame-time graph rather than just an average FPS number, since HAGS is more likely to affect frame-time consistency than peak FPS.
Hardware-Accelerated GPU Scheduling on Windows 11
Windows 11 fully supports HAGS on compatible GPUs and drivers. Before testing it, confirm three things:
- Windows is fully updated
- Your GPU driver is current
- Your specific GPU model supports the feature (most GPUs from the last several generations do)
Treat HAGS as a setting worth testing, not a guaranteed upgrade. On most systems the difference is small; on a CPU bound high-refresh setup, it’s occasionally noticeable.
AM4 Processors in 2026: Are They Still Worth Building Around?
The AM4 socket remains one of the longest-supported desktop platforms AMD has ever released, spanning multiple Ryzen generations on the same motherboards. That long lifespan is exactly why so many gamers are still running AM4 systems today, and why upgrade planning for this platform is still a relevant question in 2026.
What Is AM4?
AM4 is the processor socket used by AMD’s mainstream desktop Ryzen CPUs across five generations. It’s common in gaming PCs, streaming rigs, content-creation workstations, and everyday desktops.
Best AM4 CPU for Gaming, by Tier
| Tier | Best for | Example chips |
| Ryzen 5 | Budget-conscious and mainstream gaming | Ryzen 5 3600, Ryzen 5 5600 |
| Ryzen 7 | Gaming plus streaming, high-refresh play | Ryzen 7 3700X, Ryzen 7 5800X, Ryzen 7 5800X3D |
| Ryzen 9 | Heavy multitasking, professional and creative workloads | Ryzen 9 5900X, Ryzen 9 5950X |
Of these, the Ryzen 7 5800X3D is generally regarded as the strongest pure-gaming AM4 chip, thanks to its large 3D V-Cache, while the Ryzen 9 options are better suited to users who also render, edit, or run heavily multi-threaded workloads alongside gaming.
AM4 Ryzen Generations at a Glance
- Ryzen 1000 series — the original Zen architecture
- Ryzen 2000 series — refined Zen+, modest clock and efficiency gains
- Ryzen 3000 series — Zen 2, a major architectural jump
- Ryzen 4000 series — mobile-focused, limited desktop presence
- Ryzen 5000 series — Zen 3, the most current and best-performing AM4 generation, including the 5800X3D
Choosing an AM4 Motherboard
The motherboard determines your upgrade ceiling within the AM4 platform as much as the CPU does. Prioritize:
- VRM quality: stronger power delivery supports higher-end CPUs (especially the 5900X and 5950X) without throttling under load.
- Memory support: look for explicit support of higher DDR4 speeds and check the motherboard’s QVL list before buying RAM.
- Expansion: enough M.2 slots and USB headers for your current and near-future storage and peripherals.
- BIOS upgrade path: confirm the board has a BIOS revision supporting 5000-series chips if you plan to upgrade later, since some early B450/X470 boards need a BIOS flash first.
Who Should Use a Bottleneck Calculator?
- PC builders: confirm a CPU/GPU pairing is balanced before placing an order, not after.
- Gamers: find out whether a CPU or GPU upgrade will actually move your FPS, before spending on the wrong one.
- Upgraders: if you’re replacing one component at a time, this tells you which one to replace next.
- Content creators: editing and rendering workloads stress CPU and GPU differently than gaming does, so it’s worth checking both.
- Streamers: streaming adds encoding on top of gaming, which shifts the CPU/GPU balance you need.
Frequently Asked Questions
What is a bottleneck calculator?
A tool that estimates whether your CPU and GPU are balanced, and flags hardware pairings likely to limit your overall performance.
How does a bottleneck calculator work?
It compares normalized benchmark scores for your processor and graphics card, adjusts for your selected resolution, and factors in your workload type to estimate where the performance ceiling sits.
How accurate is a bottleneck calculator?
It provides a useful estimate, not an exact prediction. Real world results depend on game optimization, settings, drivers, and background software.
What is an acceptable bottleneck percentage?
Small bottlenecks are normal in every system. Generally, under 10% is negligible, 10–20% is worth monitoring, and above 20% is likely to have a noticeable real-world impact.
Should I upgrade my CPU or GPU first?
Upgrade whichever one is identified as your primary bottleneck. Watch CPU and GPU utilization together: high CPU usage with low GPU usage points to the CPU; the reverse points to the GPU.
Can you fix a bottleneck without buying new hardware?
Sometimes. Updating GPU and chipset drivers, enabling XMP or EXPO memory profiles, closing background applications, and improving case airflow to prevent thermal throttling can all reduce a bottleneck without a single new part.
Final Thoughts
A bottleneck isn’t a flaw every PC has one somewhere. What matters is knowing where yours sits, and whether it’s large enough to be worth fixing. Use a bottleneck calculator alongside real benchmark data for your specific games, and let the result guide a single, targeted upgrade rather than a guess.